| Membership | Price (+HST) |
|---|---|
| Single | $85/year |
| Single Plus | $120/year |
| Family | $130/year |
| Family Plus | $175/year |
| Contributing | $300/year |
| Supporting | $600/year |
| Sustaining | $1,000/year |
| Benefactor's Circle | $2,500/year |
| Director's Circle | $5,000/year |
| President's Circle | $10,000/year |
Sustainability
About Sustainability at RBG
At RBG our mission is to connect people, plants and place for the purpose of nurturing and preserving healthy growing life on our planet. We are a biodiversity based organization, and we know that climate change poses enormous threats to the plants that sustain our planet. Thus our mission, mandate and future are deeply connected to sustainability – working to meet our needs today in a way that doesn’t compromise the ability of future generations to meet theirs.
As part of our sustainability efforts we look to engage with other groups who share our goals. RBG is a member of Sustainable Hamilton Burlington’s Sustainability Leadership Program (formerly the Sustainable Business Initiative) and a participating member of the American Public Gardens Association’s Public Garden Sustainability Index.
Sustainability Projects
We’ve completed a variety of types of projects to reduce our impact at RBG. Learn more about the specific projects that we’ve rolled out, how they’ve reduced our impact, and what we’ve learned along the way.
We’ll be keeping this up to date as more projects complete so check back soon!
Sustainability Highlights
-
54%
waste diverted from landfill (in 2019)
-
16%
annual reduction of water consumption (in 2019)
-
$3.7k
estimated avoided waste costs using monitoring equipment (in 2019)
Environmental Performance
To understand our environmental impact, we track our greenhouse gas emissions, water consumption and waste diversion. We believe that you can’t manage what you don’t measure and these metrics help us better understand the impact of our operations. As part of this process we want to share this data with our members and the public to be transparent with our efforts and progress.
Greenhouse Gas Emissions
Goal: 20% from our 2017 Baseline by 2027
Updated March 2023
RBG has committed to reducing our greenhouse gas emissions (GHGs) by 20% of our 2017 emissions over ten years. This target was selected as part of Sustainable Hamilton Burlington’s “Sustainable Business Initiative” in 2018 (now known as Sustainability Leadership). As part of our GHG emissions calculation we take into consideration the energy used to heat and power our facilities, the fuel used to operate our vehicles, tools and equipment, as well as employee business travel. Using Sustainability Leadership’s carbon accounting tool, we convert our data into tonnes of carbon dioxide equivalent (CO2e) on an annual basis.
While we have been making efforts to reduce our greenhouse gas emissions, we are not currently on track to meet our reduction target, with our aging and inefficient propagation and display greenhouses being among our largest emission sources. Check back in the future for blog posts with more information on our greenhouse gas emissions and the initiatives we are taking to reduce them.
2022 Review
- Solar powered lights were installed at Princess Point
- We purchased an electric fleet vehicle for use by catering for delivering of services at multiple RBG sites.
- 2022 was our second highest year for GHG emissions since setting a reduction target.
- Options were investigated to heat the Rose Garden tent in Hendrie Park with electric heat initially, but the electrical capacity was not sufficient for the space. A different heater supplier was used with a design featuring a recirculation system which was expected to reduce propane consumption. It was expected we would see a 30-50% reduction in propane emissions but despite the recirculating system and a warmer winter, overall emissions for heating the Rose Garden tent increased by ~8 tonnes CO2e compared to 2021.
- Grass cutting was outsourced to external party this year. This means the emissions associated with grass cutting that would have been captured in our fleet management system were now the emissions of our service provider and scope 3 emissions. Overall our fleet emissions increased despite this change.
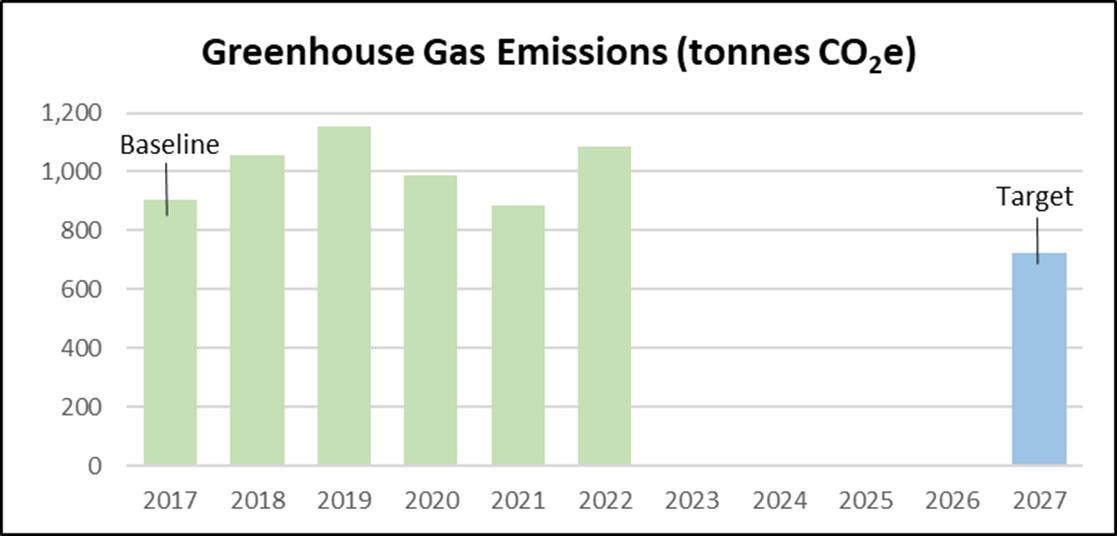
Our GHG emissions are determined using activity data from our electricity, natural gas and propane utility bills, our internal fuel tracking system, and our employee mileage expenses which are converted to tonnes of CO2e using the Sustainability Leadership Program’s Carbon Accounting Tool.
Water Consumption
Updated March 2023
As a botanical garden we have a significant demand for water to irrigate our living collections. While we’re making efforts to choose plants that aren’t as “thirsty” where we can, it is critical that we track water consumption in detail so we can identify areas where there are opportunities to conserve and reduce our impact. We have many kilometers of irrigation lines and have invested in our systems to better monitor water use in our gardens and our buildings in the last two years and we are seeing a reduction as a result.
2022 Review
- A significant meter read issue at the Rock Garden was resolved in February 2023 requiring the adjustment of water bills and retroactive charges. The data is this report and in the table above represents the accurate true water consumption for 2021 which has increased by roughly 7,000 m3 from what was first reported.
We are still working on a target for reduction. To learn more about our water conservation initiatives check back for future blog posts.
Waste Diversion
Updated Machr 2023
Waste Diversion is a measure of how much material disposed is diverted away from landfill to be recycled or re-used. A 100% diversion rate would mean nothing is going to landfill, so a higher diversion rate is ideal. In 2017 we invested in an entirely new waste diversion program and rolled out dozens of new two- and three-stream bins. We set a goal to achieve a 65% diversion rate, aligned with Halton Region’s Waste Diversion target at the time. While we have seen improvements, and have most recently created a single-use plastics policy, we still have a ways to go to reach our target. Part of the challenge in reaching our goal is that some material can’t be recycled at RBG, such as most commercial coffee or drink cups (the cups we use at RBG are all BPI certified compostable).
2022 Review
- Our diversion rate has been hovering around 55% since our last major system update. In 2021 audits were completed to help inform updates to outdoor signage planned for 2022.
- Additional waste diversion services have been expanded upon to allow for improved collection of internal electronic and battery recycling services
For more information on our waste diversion initiatives check back for future blog posts.
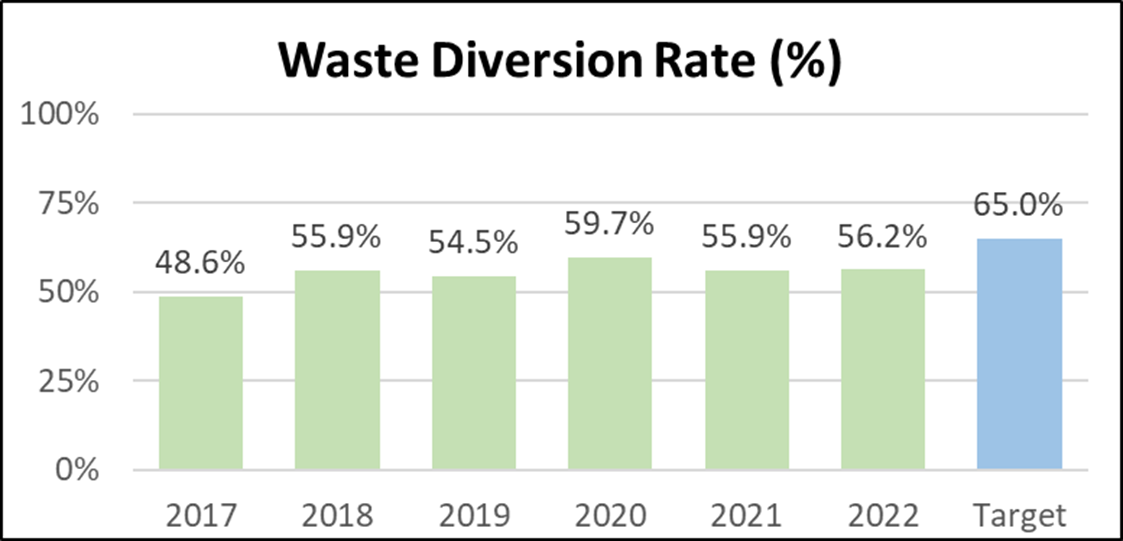
Our waste diversion rate is calculated using service summaries from multiple waste and recycling service providers.
RBG’s Sustainability in the News
Read more about RBG’s sustainability efforts from our partners and news outlets!
Green Economy Canada
Sustainable Hamilton Burlington
Hamilton Spectator
Sustainability Leadership
- Environmental Leadership Award: 2020
Scented Gardens Permeable Pavers Project

Support Sustainability at RBG
These projects are possible thanks to the generous support of RBG Members and donors. With a donation to Growing up Green, you can ensure an active, vibrant and healthy future for the children of today and tomorrow through our horticultural and conservation projects.

